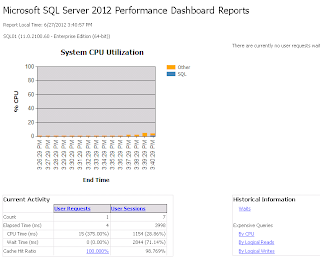
As with the earlier versions of these reports they allow a database administrator to quickly identify whether there is a current bottleneck on the system, and capture additional diagnostic data that can help resolve some common problems such as:
- Common performance problems that can be indeitifed through the dashboard are CPU bottlenecks (and what queries are consuming the most CPU)
- IO bottlenecks (and what queries are performing the most IO)
- Index recommendations generated by the query optimizer (missing indexes)
- Blocking
- Latch contention
There are 3 parts to the deployment process.
- Run the run installer. The dashboard automatic install path places the files in C:\Program Files (x86)\Microsoft SQL Server\110\Tools\Performance Dashboard.
- In the Performance Dashboard folder execute the setup.sql script.
- Test the deployment by opening a report. Open the report by selecting the server instance in SQL Server Maangement Studio (SSMS) and in the menu options select Reports, then; Custom reports and navigate to the install path C:\Program Files\Microsoft SQL Server\110\Tools\Performance Dashboard. Then select performance_dashboard_main.rdl and Click open and select Run.

No comments:
Post a Comment
Note: only a member of this blog may post a comment.